
If you've ever felt like Salesforce Flow Testing was more of an art than a science, you aren't alone. I've spent plenty of late nights squinting at the debug logs, trying to figure out exactly which element caused a record to trip up. It's frustrating when you know your logic is solid but the execution just won't behave.
But things are actually starting to look up. During the recent True to the Core Deep Dive, the product team showed off some updates that actually solve real problems for those of us living in the Flow Builder every day. We aren't just talking about minor UI tweaks here - we're talking about a shift in how we handle errors and deployments.
The New Reality of Salesforce Flow Testing
One of the biggest headaches I've seen teams face is the sheer noise in the debug side panel. It used to be a wall of text that you had to scroll through like a CVS receipt. Now, we're getting a unified debug panel. It uses a card-based layout that groups your setup, design, and results into digestible chunks. It's much faster to scan, and honestly, it makes it way harder to miss a failing element.
Now, here's the thing that really caught my eye: the jump-to-element feature. If a card shows a failure, you can click it and the builder zooms right to that element on the canvas. No more hunting through a massive auto-layout looking for "Update Records 3". It's a small change, but when you're working on complex logic involving bulk record processing, every second saved matters.
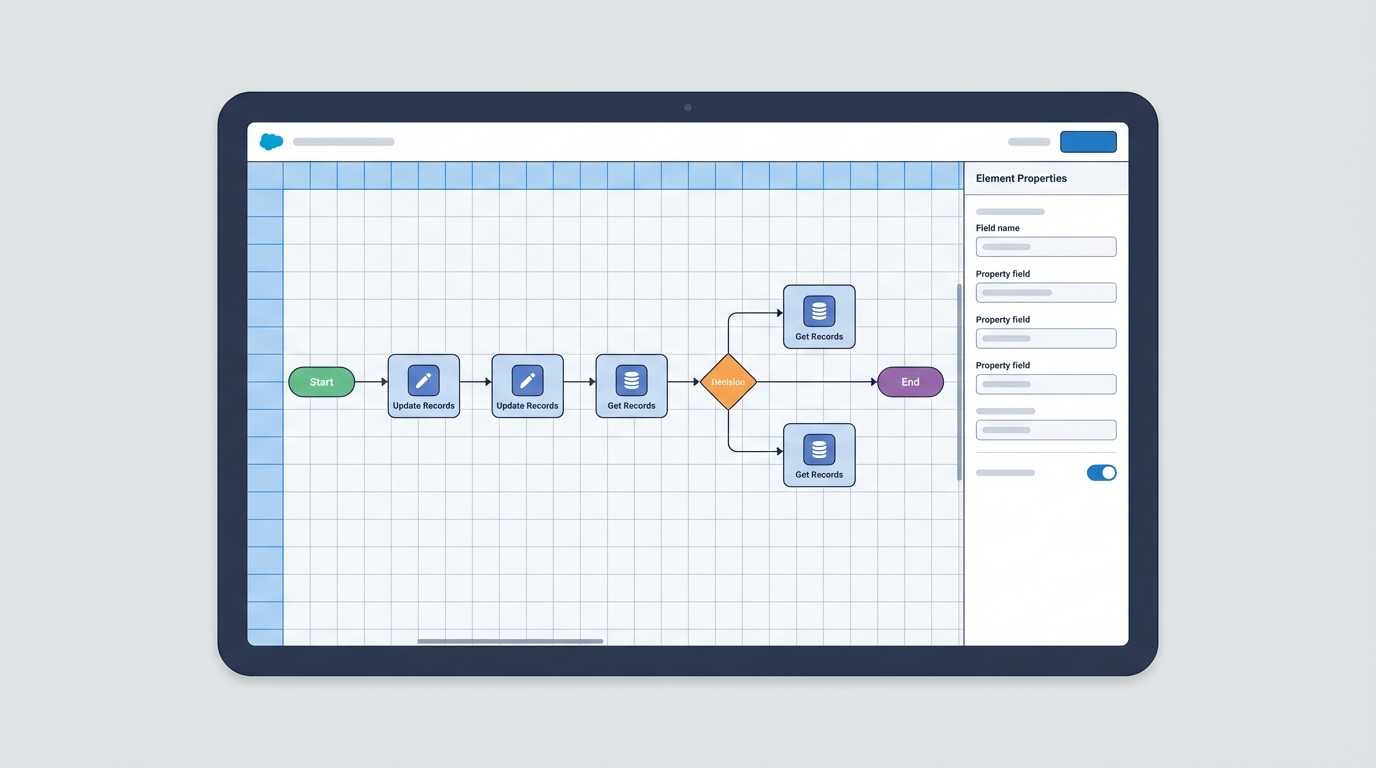
A professional UI mockup of the Salesforce Flow Builder showing a complex sequence of logic nodes and data update elements in a clean auto-layout view.
Better Screen Flows and Salesforce Flow Testing
Screen flows have always been the "problem child" of debugging. You'd run the debugger, and it would feel totally disconnected from the actual user experience. The new updates let you toggle back and forth between the UI screen and the flow canvas while the debug session is active. This is huge for reproducing those weird "it only happens for this specific user" bugs.
I've seen so many admins get stuck because they couldn't see how the data was changing behind the scenes while they were typing into a text component. Now you can. It's much more interactive. If you're staying on top of the Salesforce Spring '26 Flow updates, you'll notice this fits right into their goal of making the builder feel more like a professional IDE.
Stop testing only the "happy path". Your users are creative at breaking things, so your Salesforce Flow Testing needs to be even more creative at catching them before they hit production.
Scaling with a Unified Salesforce Flow Testing Framework
So what does this actually mean for developers? For a long time, Flow and Apex felt like they lived in two different worlds. If you wanted to run a full test suite, you'd jump between the Test Execution page and the Flow Builder. But the roadmap includes a unified test framework. This lets you run your Flow tests alongside your Apex code using the Tooling API and CLI.
This is where it gets interesting for DevOps. You can finally add these tests to your CI/CD pipelines. I've worked with teams where a "simple" Flow change broke an Apex trigger three steps down the line. By including Salesforce Flow Testing in your quality gates, you catch those collisions before the deployment even starts. It's about building confidence in your releases.
Practical Best Practices
- Don't just run the debugger - use the panel to capture logs for your developers if you need to escalate a bug.
- Build tests for different user profiles. A Flow that works for a System Admin might fail for a Sales Rep due to field-level security.
- Check your run cards for performance hotspots. If you see a loop running 500 times, it's time to rethink your architecture.
- I always recommend following Salesforce Flow best practices like avoiding DML inside loops, even if the new debugger makes it look okay.
Key Takeaways
- The unified debug panel turns messy logs into readable cards.
- Screen flow debugging now allows toggling between the UI and the canvas.
- Salesforce Flow Testing can now be integrated into CLI and CI/CD pipelines.
- Jumping from a debug error directly to a canvas element saves massive amounts of time.
Investing a little time in learning these new tools pays off almost immediately. You'll spend less time fixing bugs and more time actually building things that help your users. Go ahead and try out the new debug panel in your sandbox - your future self will thank you for it.


Leave a Comment