
Recently while navigating the COVID-19 Live Count link shared on group, I found Covid19India.org have exposed the API endpoints publicly. Thought to build a dashboard using Charts.js and publish it for guest users using community.
The interesting part with this project is, not a single apex class is involved to make API callout. All the API callouts are made using native "Fetch" method from JavaScript. Of course its not secure for the authenticated callout, but you should give a try.
COVID-19 Live Dashboard
Live Demo (Integrated using Lightning Out) : https://sfdcdevelopers.com/covid-19-live-dashboard/
GIT repository is shared at the end of article. Now, lets go through components involved:
Components Involved:
Corona_Chart_Scripts.resource
As lightning components do not support CDN links, I downloaded the Charts.js from official website, added into the zip and uploaded as static resource.
India_Corona_Map.cmp
<aura:component implements="flexipage:availableForAllPageTypes,forceCommunity:availableForAllPageTypes" >
    <aura:attribute name="selectedState" type="String" default="Maharashtra"></aura:attribute>
    <aura:attribute name="states" type="list"></aura:attribute>
    <aura:attribute name="stateData" type="Object"></aura:attribute>
    <aura:attribute name="stateChartInstance" type="Object"></aura:attribute>
    <aura:attribute name="isLoading" type="boolean" default="true"></aura:attribute>
    <ltng:require scripts="{!$Resource.Corona_Chart_Scripts+'/Chart.min.js'}"
                  afterScriptsLoaded="{!c.initialiseSetup}">
    </ltng:require>
    <div class="body">
        <aura:if isTrue="{!!v.isLoading}">
            <div class="slds-grid slds-wrap">
                <div class="slds-col slds-size_1-of-1 slds-large-size_6-of-12">
                    <div class="slds-box slds-m-around_xx-small">
                        <canvas aura:id="dailyCount"></canvas>
                    </div>
                </div>
                <div class="slds-col slds-size_1-of-1 slds-large-size_6-of-12">
                    <div class="slds-box slds-m-around_xx-small">
                        <canvas aura:id="overallCount"></canvas>
                    </div>
                </div>
                <div class="slds-col slds-size_1-of-1 slds-large-size_6-of-12">
                    <div class="slds-box slds-m-around_xx-small">
                        <canvas aura:id="historicalPerDayCount"></canvas>
                    </div>
                </div>
                <div class="slds-col slds-size_1-of-1 slds-large-size_6-of-12">
                    <div class="slds-box slds-m-around_xx-small">
                        <canvas aura:id="historicalTotalCount"></canvas>
                    </div>
                </div>
                <div class="slds-col slds-size_1-of-1">
                    <div class="slds-box slds-m-around_xx-small">
                        <lightning:select label="Select State" value="{!v.selectedState}" onchange="{!c.onSelectState}">
                            <aura:iteration items="{!v.states}" var="state">
                                <option text="{!state}" value="{!state}" selected="{!state == v.selectedState}"></option>
                            </aura:iteration>
                        </lightning:select>
                        <canvas aura:id="stateCount"></canvas>
                    </div>
                </div>
            </div>
            <aura:set attribute="else">
                <div class="spinnerHolder">
                    <lightning:spinner class="spins" alternativeText="Fetching data from API.." size="large" />
                </div>
            </aura:set>
        </aura:if>
    </div>
</aura:component>
India_Corona_MapController.js
- There are two callouts made, so used Promise.all to complete both the callouts before proceeding with further data operations.
({
    initialiseSetup : function(component, event, helper) {
        Promise.all([helper.fetchData(component, 'https://api.covid19india.org/v2/state_district_wise.json' ,'v.nationalData'),
        helper.fetchData(component, 'https://api.covid19india.org/data.json' ,'v.stateData')])
        .then(values => {
            component.set("v.isLoading", false);
            let nationalData = values[1];
            let stateData = values[0];
            const lastArrayIndex = nationalData.cases_time_series.length - 1;

            //draw donut for todays cases
            helper.todaysCasesDonut(component, nationalData.cases_time_series[lastArrayIndex]);

            //draw donut for todays cases
            helper.overallCasesDonut(component, nationalData.cases_time_series[lastArrayIndex]);

            //last 5 days count
            const lastFiveDaysData = [];
            for(let i = 0 ; i < 5 ; i ++)
            	lastFiveDaysData.push(nationalData.cases_time_series[lastArrayIndex - i]);

            //historical per day count for past 5 days
            helper.historicalPerDayCount(component, lastFiveDaysData);

            //historical overall count for past 5 days
            helper.historicalTotalCount(component, lastFiveDaysData);

            //find state list
            let states = [];
            let districtDataByState = {};
            stateData.forEach(st => {
            	states = [...states, st.state];
                districtDataByState[st.state] = st.districtData;
        	});

            component.set("v.states", states);
            component.set("v.stateData", districtDataByState);

            //statewise count
            helper.stateWiseCount(component);
        })
        .catch( err => console.log(err));
	},
    onSelectState : function(component, event, helper){
        //statewise count
        helper.stateWiseCount(component);
    }
})
India_Corona_MapHelper.js
- fetchData method is responsible to call the endpoint and pass the response back to controller.
- Other methods are preparing the required configs for respective chart types. You can refer Chart.Js documentation for any configs.
({
    fetchData : function(component, endpoint, variable){
        return new Promise((resolve, reject) => {
            fetch(endpoint)
            .then(response => {
                return response.json();
            })
            .then(data => {
                resolve(data);
            })
            .catch(err => {
            	reject(err);
            });
        });
    },
    todaysCasesDonut : function (component, todaysCases){
        const chartData = {
            labels: ['Confirmed', 'Deceased', 'Recovered'],
            datasets: [{
                          label: "Daily Cases",
                          backgroundColor: ["#8B0000", "#FF4500","#006400"],
                          data: [todaysCases.dailyconfirmed, todaysCases.dailydeceased, todaysCases.dailyrecovered]
                        }]
        };
        const chartOptions = {
            title: {
                display: true,
                text: 'Todays cases in India'
            },
            animation: {
                duration: 2000
            }
        }
        this.generateChart(component, 'dailyCount', chartData, 'doughnut', chartOptions);
    },
    overallCasesDonut : function (component, overallCases){
        const chartData = {
            labels: ['Confirmed', 'Deceased', 'Recovered'],
            datasets: [{
                          label: "Till Date Cases",
                          backgroundColor: ["#8B0000", "#FF4500","#006400"],
                          data: [overallCases.totalconfirmed, overallCases.totaldeceased, overallCases.totalrecovered]
                        }]
        };
        const chartOptions = {
            title: {
                display: true,
                text: 'Till date cases in India'
            },
            animation: {
                duration: 2000
            }
        }
        this.generateChart(component, 'overallCount', chartData, 'doughnut', chartOptions);
    },
    historicalPerDayCount : function (component, lastFiveDaysData){
        let labels = [];
        let confirmedData = [];
        let deseasedData = [];
        let recoveredData = [];
        lastFiveDaysData.forEach(info => {
            labels = [...labels, info.date];
            confirmedData = [...confirmedData, info.dailyconfirmed];
            deseasedData = [...deseasedData, info.dailydeceased];
            recoveredData = [...recoveredData, info.dailyrecovered];
        });

        const chartData = {
            labels,
            datasets: [{
                    label: "Confirmed",
                    backgroundColor: "#8B0000",
                    data:confirmedData
                },{
                    label: "Deceased",
                    backgroundColor: "#FF4500",
                    data: deseasedData
                },{
                    label: "Recovered",
                    backgroundColor: "#006400",
                    data: recoveredData
                }]
            };
        const chartOptions = {
            title: {
                display: true,
                text: 'Per day cases for last 5 days'
            },
            animation: {
                duration: 2000
            }
        }
        this.generateChart(component, 'historicalPerDayCount', chartData, 'bar', chartOptions);
    },
    stateWiseCount : function (component, lastFiveDaysData){
        let labels = [];
        let data = [];
        let backgroundColor = [];
        const selectedState = component.get("v.selectedState");
        const districtInfo = component.get("v.stateData");
        const selectedStateDistrictInfo = districtInfo[selectedState];
        selectedStateDistrictInfo.forEach(dist => {
            labels = [...labels, dist.district];
            data = [...data, dist.confirmed];
            backgroundColor = [...backgroundColor, '#'+(Math.random()*0xFFFFFF<<0).toString(16)];
        })

        const chartData = {
            labels,
            datasets: [{
                label: "Districts",
                backgroundColor,
                data
            }]
        }
        const chartOptions = {
            title: {
                display: true,
                text: "Districts level confirmed cases for "+selectedState+" state"
            },
            animation: {
                duration: 2000
            }
        }
        this.generateChart(component, 'stateCount', chartData, 'bar', chartOptions);
    },
    historicalTotalCount : function (component, lastFiveDaysData){
        let labels = [];
        let confirmedData = [];
        let deseasedData = [];
        let recoveredData = [];
        lastFiveDaysData.forEach(info => {
            labels = [...labels, info.date];
            confirmedData = [...confirmedData, info.totalconfirmed];
            deseasedData = [...deseasedData, info.totaldeceased];
            recoveredData = [...recoveredData, info.totalrecovered];
        });

        const chartData = {
            labels,
            datasets: [{
                    label: "Confirmed",
                    backgroundColor: "#8B0000",
                    data:confirmedData
                },{
                    label: "Deceased",
                    backgroundColor: "#FF4500",
                    data: deseasedData
                },{
                    label: "Recovered",
                    backgroundColor: "#006400",
                    data: recoveredData
                }]
            };
        const chartOptions = {
            title: {
                display: true,
                text: 'Overall cases for last 5 days'
            },
            animation: {
                duration: 2000
            }
        }
        this.generateChart(component, 'historicalTotalCount', chartData, 'bar', chartOptions);
    },
	generateChart : function(component, chartId, chartData, chartType, chartOptions) {
        var ctx = component.find(chartId).getElement();
        ctx.height = 250;
        if(chartId == 'stateCount' && component.get("v.stateChartInstance") != null)
            component.get("v.stateChartInstance").destroy();
        var lineChart = new Chart(ctx ,{
            type: chartType,
            data: chartData,
            options: chartOptions
        });
        if(chartId == 'stateCount')
            component.set("v.stateChartInstance", lineChart);
	}
})
Corona_Map.app
Its a container which will show output of the component.
<aura:application extends="force:slds">
	<c:India_Corona_Map></c:India_Corona_Map>
</aura:application>
We all done from coding side, now lets review the app now. Wait, just getting spinner, not a dashboard! Why this happening? Lets check browser console.

CSP Trusted Site Error
Yes, this is blocking the callout due to content security policy. In short, Salesforce not allowing to make callout to endpoint without its being marked as CSP Trusted Site.
How to white list the endpoint domain?
- Navigate to Setup -> Security Controls -> CSP Trusted Sites
- Create the entry as follows:
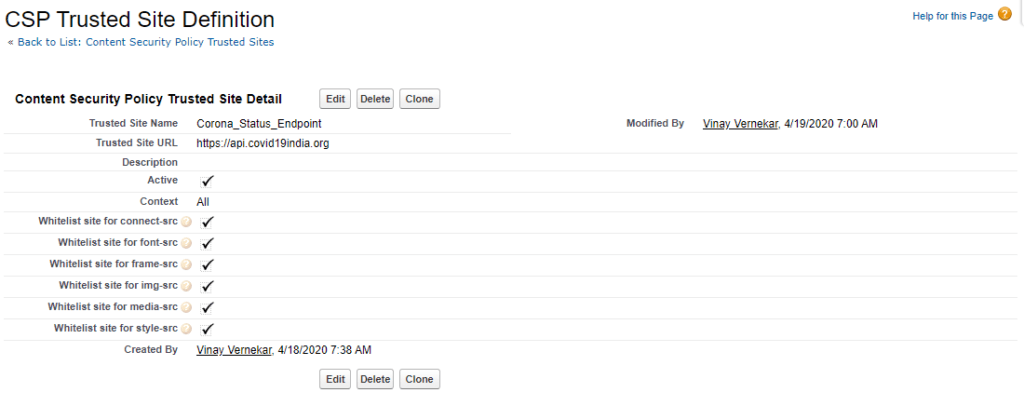
CSP Trusted Site Entry
Voila, It should be working now! Comment if you face any issues.


Leave a Comment