
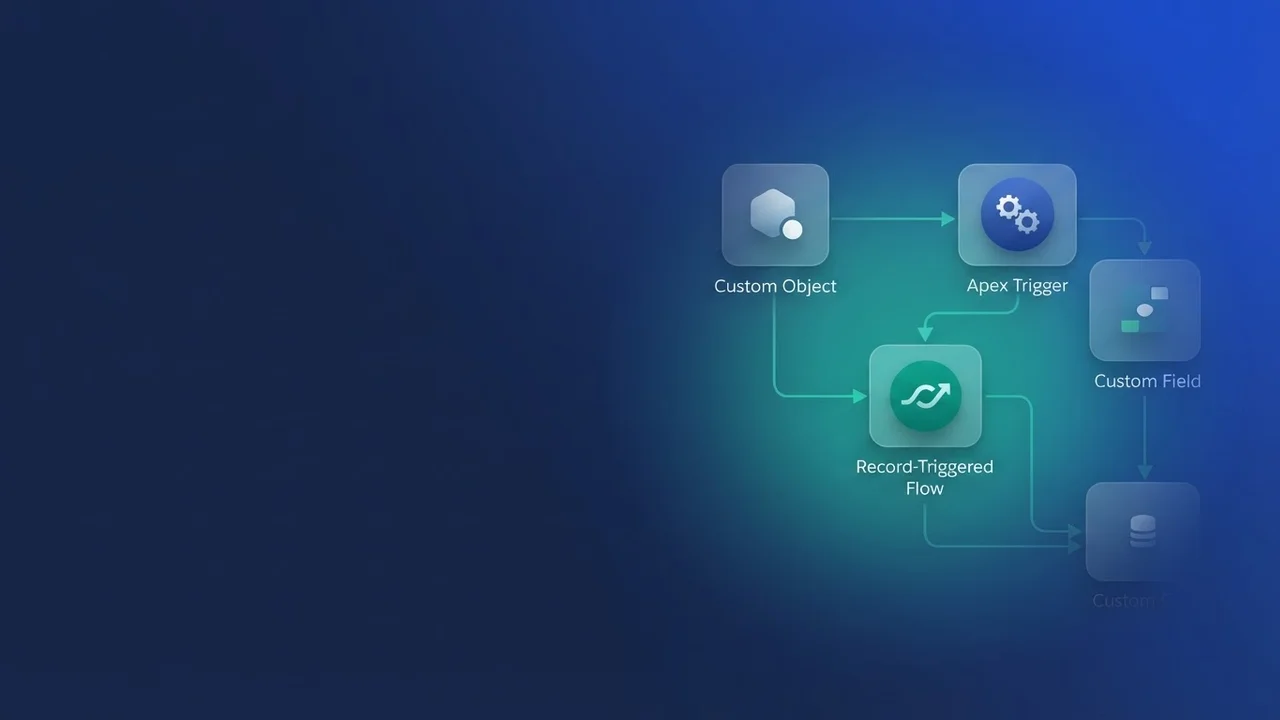

Speeding up org understanding with dependency analysis tools
If you build, admin or architect on a large Salesforce instance, the slow part of any change is usually the part before the change: working out what is already there. Tracing dependencies by hand across Apex triggers, Flows, validation rules and reports eats days, and it is easy to miss one. The references you miss come back as failed deployments or as regressions after go-live.
Discovery platforms aim to automate that reading of existing metadata, and report on configuration complexity, technical debt and the blast radius of a change.
Analyzing org structure via metadata analytics
Discovery starts with an automated pass over every configured component, and the job of that pass is to map how those components actually relate to each other.
Object complexity mapping
For a custom or standard object, the number worth having is how often automation touches it. For something like Opportunity, the analysis should surface on its own:
- Total fields, validation rules and page layouts.
- References inside Apex classes and triggers.
- Appearances in Flow execution paths (Get, Create, Update and Delete elements).
An object referenced over 200 times across various Flows gives you a complexity reading straight away:
Object: Opportunity
Flow Touchpoints: 200+
Deep Dive: Access Flow definitions, API version, and calculated complexity scores for each referencing Flow.
Identifying technical debt
Technical debt here is old configuration that turns into risk the moment you modify or deploy it. Worth finding automatically:
- Apex classes that are not compiled against the latest supported API version.
- Flows with no fault paths, which makes the process fragile.
- Apex triggers and classes sitting below your code coverage threshold.
Configuration mining and end-to-end process visualization
Knowing what metadata exists still leaves the question of how it behaves inside a full business process. Configuration mining tools draw process diagrams of the execution path and show which Salesforce features and which roles are involved at each step.
A diagram like that lines a business requirement up against the implementation underneath it, and shows where a practice such as UPN standards or automation placement may have been broken.
The dependency explorer: assessing change impact
Before you change a field definition or deprecate a custom Apex method, you want an accurate forecast of what downstream of it will move.
Dependency exploration usually gives you two views for two audiences:
- A dependency tree, which shows the chain of impacts in a form anyone can read.
- A filterable grid, for the technical team that needs the exact dependencies.
When the change under review is a field deletion, the explorer has to break usage down across configuration artifacts such as reports:
Metadata Type: Report
Total Dependencies: 300+
Usage Filter Examples:
- Group By: 15 reports
- Column Display: 250 reports
- Filter Criteria: 35 reports
- Last Run Date: [Filterable attribute to assess report relevance]
That breakdown gives you the scope immediately: whether the change touches static reports only, or automations that run constantly.
Continuous monitoring of metadata changes
With several developers, several sandboxes and regular production releases, metadata drift is worth tracking. Systems that do this connect to more than one org, sandboxes and production alike, and log every create, modify and delete event.
Notifications should be configurable, email or Slack, and link straight into logs that say what changed, when, and who started it. That gives you an audit trail which does not depend on the Setup Audit Trail.

Leave a Comment