


Why OmniScript performance is a deal-breaker
If you've ever watched a loading spinner go round for ten seconds while trying to finish a simple guided flow, you know why OmniScript performance deserves your attention. I've seen projects where the business logic was perfect and user adoption was still zero, because the screens felt sluggish. Slow tools produce frustrated users and, eventually, a pile of support tickets you don't want to deal with.
Speed here comes down to how much data you push back and forth, and how often you ask the server for help. In my experience that's where almost every slow script goes wrong: massive JSON payloads and too many separate server calls.
Quick wins for better OmniScript performance
Check these before you start digging into complex code. They usually give you the biggest speed boost for the least amount of effort.
- Always use Integration Procedures (IPs) instead of calling multiple DataRaptors directly.
- Clean up your JSON. If you aren't using a field on the screen, don't keep it in the data tree.
- Only load data when you actually need it. Pre-loading everything at the start is a performance killer.
- Combine your server requests. One "heavy" call is almost always better than five "light" ones.
- Use the browser's Network tab and OmniStudio logs to see exactly what is taking so long.
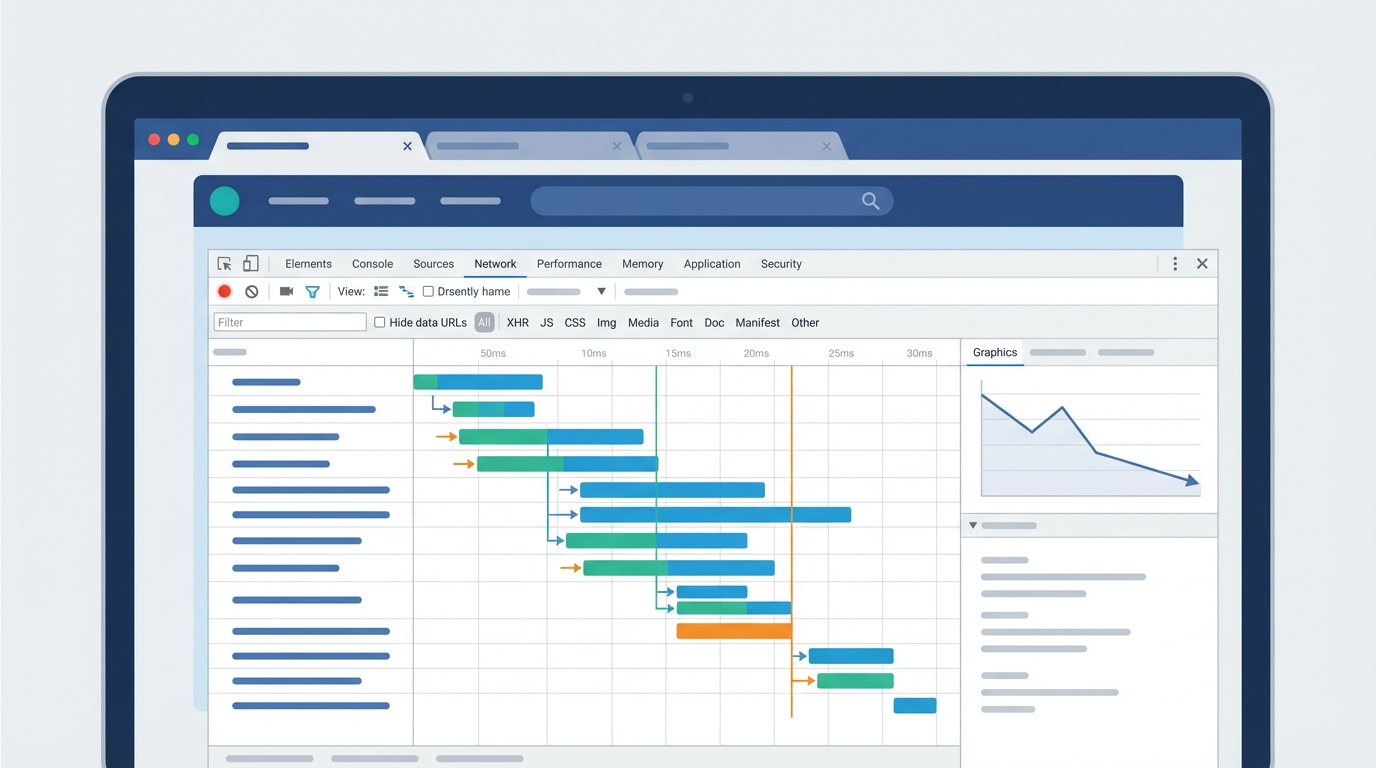
Browser network tab showing request timing for each call in a page load.
Real-world ways to boost OmniScript performance
1) Stop making so many server trips
Every time your OmniScript reaches out to Salesforce, there's a cost. Even a fast DataRaptor has to deal with network latency and overhead. I've seen teams fire off three different extracts on the first step just to get basic account info, when all three could have been wrapped into a single Integration Procedure.
With an IP, the heavy lifting happens on the server side. The OmniScript makes one request, the IP runs all your logic, and it sends back one clean package of data. That's probably the most overlooked way to make your UI feel snappier.
2) Trim the fat from your JSON
The JSON data tree runs everything in your OmniScript, and it can get bloated fast. If you're pulling in 50 fields from an Account but only showing three, you're forcing the browser to carry around a lot of dead weight. Keeping the data organized with standard naming conventions helps here, because you can see at a glance what's actually necessary.
Smaller JSON means faster parsing and less memory usage on the user's device. I always tell my devs to use the "Send/Response Transformations" in their actions to filter out the noise. If the user doesn't see it, the OmniScript shouldn't know about it.
3) Use lazy loading for complex sections
You don't need to fetch the entire history of a customer's cases when they're only on the first page of an intake form. Use Conditional Views to hide complex groups until they're needed. Better still, use a "Post Action" to fetch that specific data only when the user clicks "Next" or expands a section. The initial load time stays low and the experience stays smooth.
One thing that trips people up is thinking they need all the data upfront for "just in case" scenarios. Fetching data on demand is almost always the better architectural choice for OmniScript performance.
4) Smart caching and data handling
If you have picklists or reference data that doesn't change every five minutes, use caching. You can cache IP responses so the system doesn't have to re-run the same query over and over. That's a huge help when you're dealing with large data volumes where queries might naturally be a bit slower.
5) Keep the DOM simple
Every element you add in the OmniScript designer adds to the complexity of the rendered page. Too many nested groups, or conditional logic on every single field, can make the browser struggle, especially on older laptops or mobile devices. Keep your steps focused. If a page is getting too long, that's usually a sign you should break it into a separate step or a child OmniScript.
Key takeaways for OmniScript performance
| Area | Action | Impact |
|---|---|---|
| Server Calls | Consolidate into Integration Procedures | High |
| Data Volume | Filter JSON to only necessary fields | High |
| UI Rendering | Use lazy loading and conditional views | Medium |
| Logic | Move transforms to the server side | Medium |
How to measure your progress
So how do you know if your changes are actually working? Open up Chrome DevTools and look at the Network tab for the "XHR" requests. A long list of separate calls means you've got work to do. The "Time" column tells you which ones are the bottlenecks.
Don't forget the OmniStudio Action Debugger either. It's built right into the preview mode and shows you exactly how long each DataRaptor or IP took to run. Use that data to justify your refactoring. It's much easier to tell a stakeholder "I reduced load time by 3 seconds" than "I made the code better."
Start with the Integration Procedure consolidation and the JSON trimming. In most cases those two steps alone solve 80 percent of the speed problems, and the more granular UI optimizations can wait until you have the basics down.



Leave a Comment