


Will your code actually survive a massive spike in traffic? Apex Hammer is how developers and architects answer that question. It's a lightweight way to stress test Apex logic and watch how it handles concurrency before things go south in production.
What exactly is Apex Hammer?
Think of it as putting your org under a microscope while someone else shakes the table. There is no single Apex Hammer button in the Setup menu. It's a concept and a set of tools for simulating real traffic, and it helps us find those annoying governor limit issues that only pop up when fifty people try to do the same thing at the exact same time.
The tool works by running your Apex code repeatedly and in parallel. You can point it at an anonymous Apex block or a specific REST endpoint, and it then hammers that logic with multiple threads to see where the breaking point is. It's especially useful when you're trying to stay under asynchronous Apex limits, because those bottlenecks don't always show up in a single-user test run.
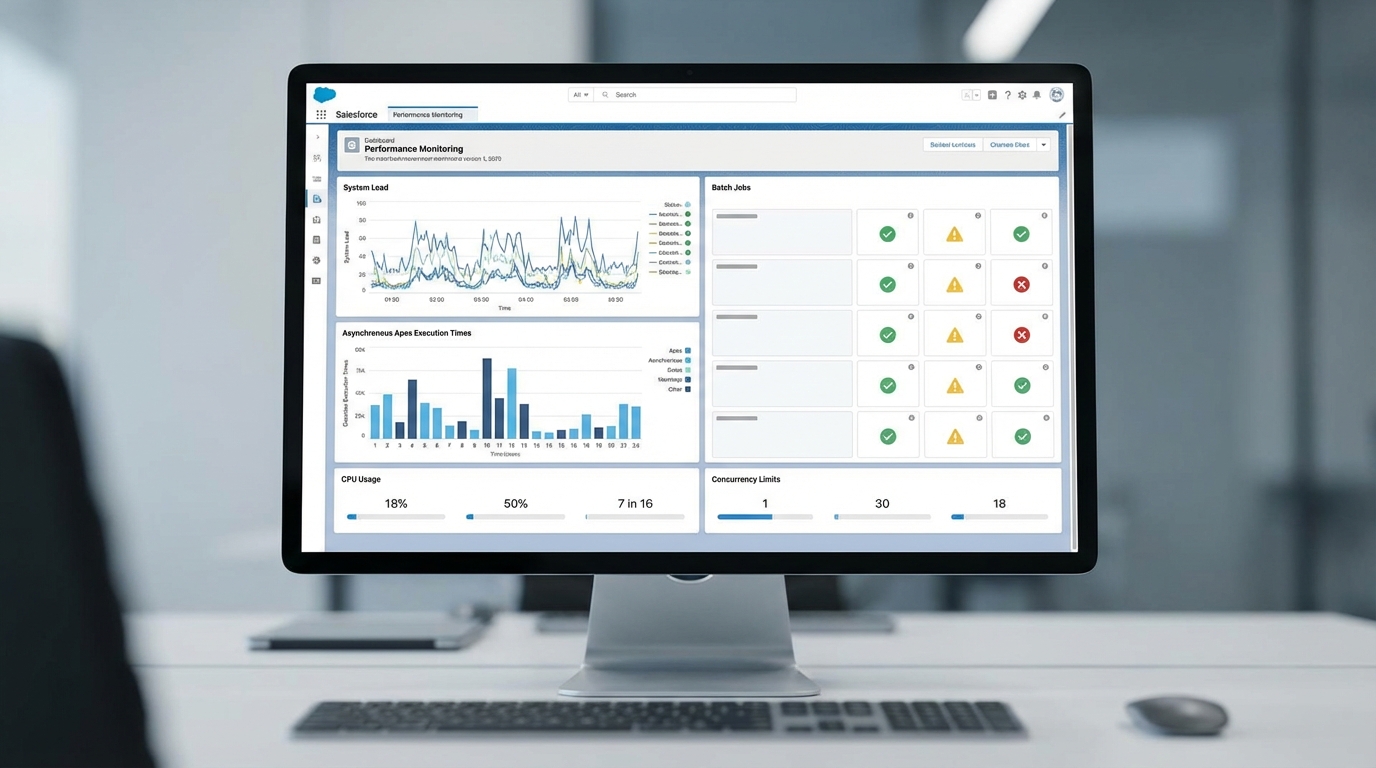
A performance monitoring dashboard showing system load graphs and Apex job execution metrics.
Why you should use Apex Hammer for load testing
I've seen teams build what they thought was a perfect integration, only to realize their batch jobs were hitting row locks every five minutes. Apex Hammer helps you catch that early. Here is why you should care about using it:
- It validates that your bulk code holds up when multiple users hit it at once.
- It identifies CPU time and heap usage spikes that unit tests usually miss.
- It helps you benchmark performance after you've refactored a messy trigger.
- It's good for simulating a Salesforce API integration hitting your endpoints at scale.
One thing that trips people up is thinking they can skip load testing because their unit tests passed. Unit tests check if the code works; load tests like Apex Hammer check if the system stays standing when 100 people hit it at once.
Safety first: Don't break production
Never run a stress test against your production org. You'll end up locking out users or hitting limits that affect the whole business. Use one of the Salesforce sandbox types instead, ideally a Full or Partial sandbox, so the results are realistic without the risk.
Start with a low number of threads and slowly ramp up. If you jump straight to 50 concurrent threads, you might crash your session before you get any useful data. Conceptually, most scripts look something like this:
apex-hammer - org sandbox.dev - threads 10 - iterations 100 - apex-file myTest.apex
Interview tips for the Apex Hammer question
If this comes up in an interview, don't give a textbook definition. Explain that it's a tool for validating behavior under load, mention that you know the risks of running it on production, and talk about alternatives like JMeter or custom Node.js scripts. That shows you've been in the trenches.
A lightweight script doesn't always cut it. When I need something more heavy-duty I reach for Apache JMeter with a Salesforce plugin, or custom SFDX scripts using jsforce to orchestrate the load. Pick the tool that matches the bottleneck you're hunting.
Key takeaways
- Apex Hammer is for load and stress testing, not just functional testing.
- It helps find concurrency issues like row locks and CPU timeouts.
- Always run these tests in a sandbox, never in production.
- Use it to benchmark your code before and after major architectural changes.
- If you need more features, look into JMeter or custom JS scripts.
So the next time you're worried about a new integration melting your org, give a tool like Apex Hammer a shot. It's much better to find your breaking point on a Tuesday afternoon in a sandbox than on a Monday morning during a global rollout. Just keep your threads low to start and watch those debug logs closely.



Leave a Comment