


You build a standard report, then the VP asks for a comparison the basic builder cannot handle. That is what Salesforce advanced reporting is for. Most of us start with simple lists, but sooner or later you need to dig deeper into the data without exporting everything to Excel every Monday morning.
Getting the most out of Salesforce advanced reporting
In my experience, many admins avoid the "advanced" side of the house because they assume it needs code. Most of these tools are purely point-and-click. They just need a bit of logic behind them. Here are the features that make a real difference in a busy org.
1. Custom Report Types
This is the foundation, and nothing else works if you get it wrong. I have seen teams force data into standard types when what they needed was a custom one to show "Accounts without Opportunities." If the basics are still fuzzy, this guide on Salesforce report types covers the difference between standard and custom.
Reach for one when you need to link up to four levels of related objects, or when you want to hide fields that only clutter the sidebar. Rename your fields in the layout editor while you are in there. "Account: Account Name" is redundant, so call it "Client Name."
2. Joined Reports
Joined reports get a bad rap because they can be slow, but they are good for side-by-side views. Put your sales pipeline in one block and support cases in the next, both grouped by the same Account, and stop jumping between tabs to compare them.
3. Cross Filters
Probably the most overlooked feature in the builder. It filters a report on related records using "with" or "without" logic. Finding Accounts that have no active Opportunities takes one filter, which beats building a whole custom report type for a one-off request.
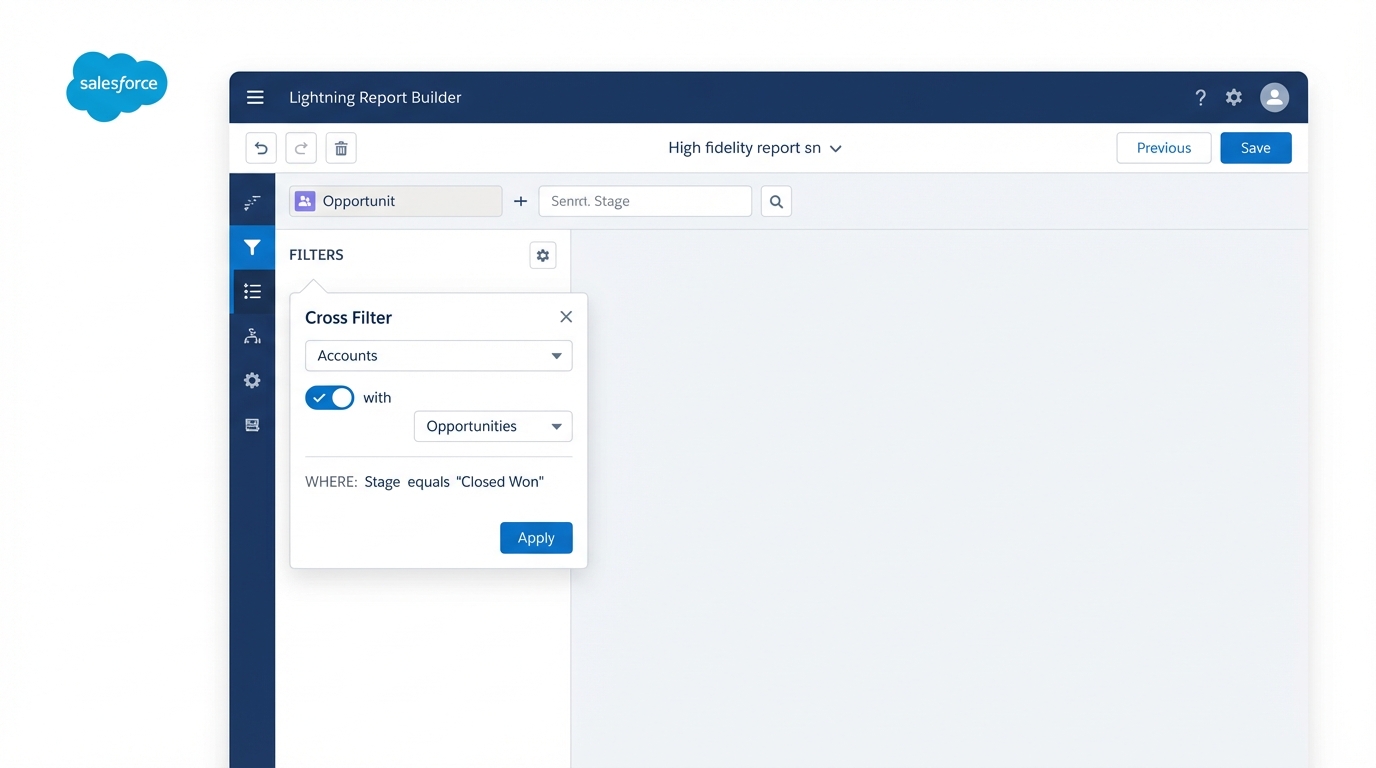
The Salesforce Report Builder with a cross filter configured between two related objects.
4. Row-Level Formulas
Before these existed, every simple calculation meant a new custom field on the object. Now you can do the math in the report itself. The number of days between two dates on a single record is a quick formula. Your schema stays clean and your developers stay happy.
One thing that trips people up: you can only have one row-level formula per report. If you need ten different calculations, you might actually need a formula field on the object instead.
Why Salesforce advanced reporting beats manual spreadsheets
I used to spend hours every month cleaning data in VLOOKUPs. These tools exist to stop that. Use the right ones and the data stays in the system, where it is secure and current.
5. Historical Trend Reporting
A manager asks what the pipeline looked like last week compared to today, and without history that is a painful question to answer. Historical trending shows how values like Amount or Close Date have shifted over time. It is built in for Opportunities and Cases, so turn it on today.
6. Summary Formulas
These work differently from row-level formulas. Summary formulas calculate at the grouping level. I use them most often for win rates: closed-won deals divided by the total number of deals in that group. It is a standard move on any sales dashboard.
Win Rate Formula:
WON:SUM / CLOSED:SUM
7. Reporting Snapshots
Historical trending only keeps data for a few months, so it will not carry you across years. Snapshots take a picture of your report and save it into a custom object. There is some setup involved, but for tracking growth over the long term it is the option that works.
8. Field-to-Field Filtering
A simple one that earns its keep. It compares two fields on the same record, so you can filter for Opportunities where "Last Modified Date" matches "Created Date." That surfaces stale data and records nobody touched after creating them.
9. Bucket Fields
Most teams get data entry wrong somewhere. You might have ten different "Lead Sources" that all mean the same thing. A Bucket Field groups them into categories like "Web," "Partner," or "Event" on the fly, which buys you time to clean the underlying data properly later.
10. Unique Count
Stop exporting to Excel just to click "Remove Duplicates." If you have a list of 500 Opportunities and want to know how many unique Accounts they belong to, click "Show Unique Count" on the Account Name column. Tiny checkbox, a lot of time saved.
Key takeaways for admins
Salesforce advanced reporting takes some practice. The points worth keeping:
- Cross filters find what is missing, using the "without" logic.
- Row-level formulas keep one-off math out of your object schema.
- Bucket fields fix messy data categories without a data load.
- Managing large data volumes can affect report performance, so filter aggressively.
The payoff is that you can say yes to more complex requests without writing a line of Apex. Start small. Pick one report you normally export to Excel and see whether you can rebuild it with one of these features. The builder is usually more capable than people expect. Test your filters and verify your totals before that dashboard reaches the board of directors.



Leave a Comment